|
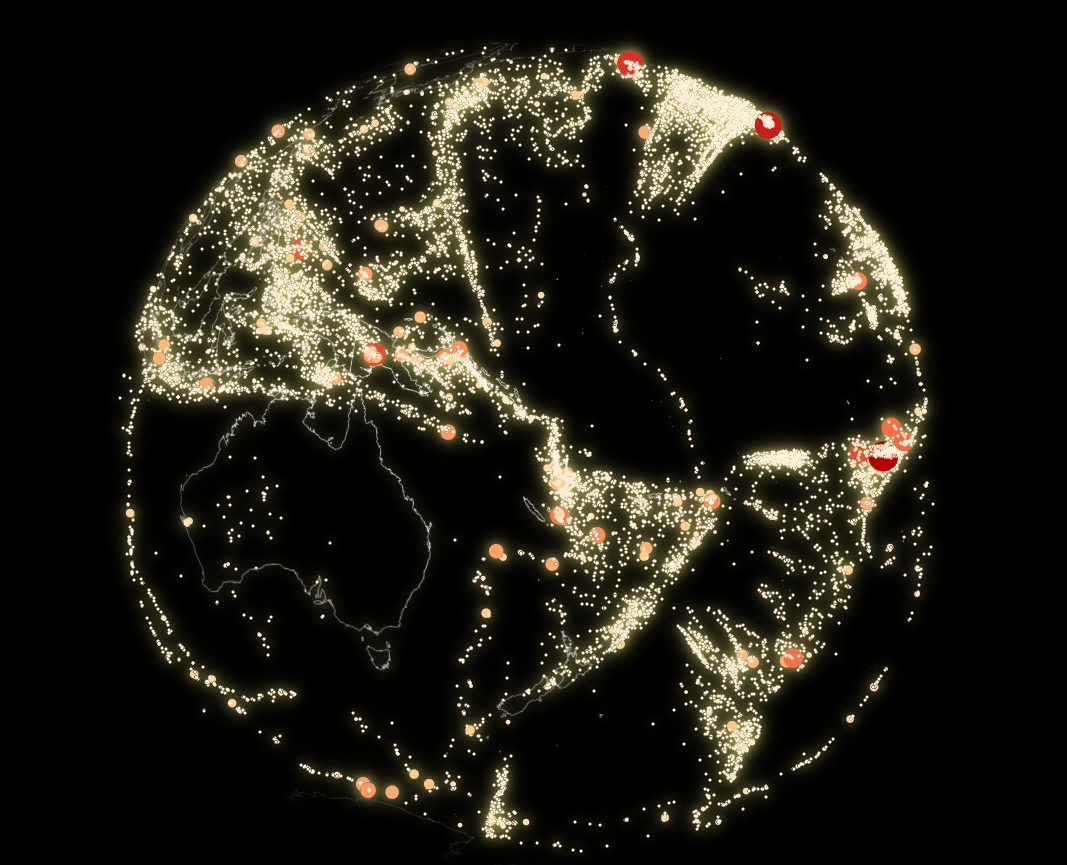
A stunning interactive map shows a year's worth of earthquakes.
The data was captured by the United States Geological Survey (USGS) between July 2017 and July 2018. The animated globe shows a year worth of earthquakes by depth. In the interactive online version you can click on each individual earthquake to learn more. Click here to view
1 Comment
19/2/2020 01:46:50 am
Reply
Your comment will be posted after it is approved.
Leave a Reply. |
Jenlogix and San LienEarthquake Warning Systems Archives
September 2021
Categories |


 RSS Feed